But sometimes, stocks get down so cheap that they become priced like options. In the Genius book, the WFC LEAPs were priced at $14 while the stock was at around $77.
Here, we have a hedge fund manager trading less than $3.00/share, which is a typical price for regular options, not even LEAPs. Of course, all stocks are options on the residual value of businesses. But sometimes things are priced for either a large gain or zero, just like an option.
I call this a perpetual option, but that reminds me of those lifetime warranties. Like, who's lifetime? The manufacturer's? The store's? Yours? Nothing is forever, so I guess there really is no such thing as a perpetual option. But anyway...
Och-Ziff IPO'ed in 2007 at $32/share and traded in the mid $20's right before the crisis, then down to below $5.00 during the crisis and back up to the mid-teens. I've been watching this since the IPO and looked at it again when it was trading around $10/share. It's down quite a bit since then. I didn't own it back then but I did take a small bite down at $5.00/share.
I have mentioned other private equity and hedge fund managers here in the past but haven't owned most of them because of the amount of money that seemed to be going into alternatives. I was just worried that the AUM's of all of these alternative managers were going up so quickly that I couldn't imagine them earning the high returns that made everyone rush to them in the first place. Look at the presentation of any of these alternative managers and their AUM growth is just staggering.
Extremely Contrarian
We investors walk around and think about all sorts of things; look at store traffic, taste new foods/restaurant concepts, count how many Apple watches people are wearing (I recently biked around the city with my kid (Brooklyn to Central Park, around the park (around the big loop) and all the way downtown back to Brooklyn (30+ miles) and I think I counted two Apple watches that I saw compared to countless iPhones. And this was in the summer so no coats or long sleeves to hide wrists).
And a couple of the things that we tend to think about are,
- What does everybody absolutely love, and what are they 100% sure of (other than that Hillary will win the election and that the market will crash if Trump wins), and
- What do people absolutely, 100% hate and don't even want to talk about?
By the Way
Oh, and by the way, in case people say that it is no longer possible due to this or that reason for humans to outperform indices or robots, I would just say that we have seen this before. Things in finance are cyclical and we've seen this movie before.
From the 1985 Berkshire Hathaway Letter,
Most institutional investors in the early 1970s, on the other hand, regarded business value as of only minor relevance when they were deciding the prices at which they would buy or sell. This now seems hard to believe. However, these institutions were then under the spell of academics at prestigious business schools who were preaching newly-fashioned theory: the stock market was totally efficient, and therefore calculations of business value -- and even thought, itself -- were of no importance in investment activities. (We are enormously indebted to those academics: what could be more advantageous in an intellectual contest -- whether it be bridge, chess or stock selection than to have opponents who have been taught that thinking is a waste of energy?)What Do People Hate?
So, back to what people absolutely hate. People hate active managers. It's not even stocks that they are not interested in. They hate active managers. Nobody outperforms and their fees are not worth it. What else do they hate? They hate hedge funds. I don't need to write a list here, but you just keep reading one institution after another reducing their exposure to hedge funds. There is a massive shakeout going on now with money leaving hedge funds. Others like Blackstone argues that this is not true; assets are just moving out of mediocre hedge funds and moving into theirs.
This is a theme I will be going back to in later posts, but for now I am just going to look at OZM.
OZM
OZM is a well-known hedge fund firm so I won't go into much detail here. To me, it's sort of a conventional equity-oriented hedge fund that runs strategies very typical of pre-Volcker rule Wall Street investment banks; equity long/short, merger arb, convertible arb etc. They have been expanding into credit and real estate with decent results. But a lot of their AUM is still in the conventional equity strategies.
What makes OZM interesting now is that chart from the Pzena Investment report (see here). These charts make it obvious why active managers have had such a hard time. The value spread has just continued to widen since 2004/2005 through now. Cheap stocks get cheaper and expensive stocks get more so. You can see how this sort of environment could be the worst for long/short strategies (and value-oriented long strategies, and even naked short strategies for that matter). Things have just been going the wrong way with no mean reversion.
But if you look at where those charts are now, you can see that it is probably exactly the wrong time to give up on value strategies or value-based long/short strategies; in fact it looks like the best time ever to be looking at these strategies.
Seeing that, does it surprise me that many pension funds are running the other way? Not at all. Many large institutions chase performance and not future potential.
Conceptually speaking, they would rather buy a stock at 80x P/E that has gone up 30%/year in the past five years that is about to tank rather than buy an 8x P/E stock that has gone nowhere in the past five years but is about to take off; they are driven by historic (or recent historic) performance.
OZM Performance
Anyway, let's look at the long term performance of OZM. This excludes their credit and real estate funds which are doing much better and are growing AUM.
This is their performance since 1994 through the end of 2015:
| OZM fund | S&P500 | |
| 1994 | 28.50% | 5.30% |
| 1995 | 23.50% | 27.40% |
| 1996 | 27.40% | 23.00% |
| 1997 | 26.70% | 33.40% |
| 1998 | 11.10% | 28.60% |
| 1999 | 18.80% | 21.00% |
| 2000 | 20.60% | -9.10% |
| 2001 | 6.30% | -11.90% |
| 2002 | -1.60% | -22.10% |
| 2003 | 24.00% | 28.70% |
| 2004 | 11.10% | 10.90% |
| 2005 | 8.80% | 4.90% |
| 2006 | 14.80% | 15.80% |
| 2007 | 11.50% | 5.50% |
| 2008 | -15.90% | -37.00% |
| 2009 | 23.10% | 26.50% |
| 2010 | 8.50% | 15.10% |
| 2011 | -0.50% | 2.10% |
| 2012 | 11.60% | 16.00% |
| 2013 | 13.90% | 32.40% |
| 2014 | 5.50% | 13.70% |
| 2015 | -0.40% | 1.40% |
| 5 year avg | 5.85% | 12.57% |
| 10 year avg | 6.69% | 7.32% |
| Since 1994 | 12.05% | 8.87% |
| Since 2000 | 7.59% | 5.01% |
| Since 2007 | 5.14% | 6.53% |
So they have not been doing too well, but it's really only the last couple of years that don't look too good. Their ten-year return through 2013 was +8.2%/year versus +7.4%/year for the S&P 500 index. It's pretty obvious that their alpha has been declining over time.
For those who want more up-to-date figures, I redid the above table to include figures through September-end 2016. And instead of 5 year and 10 year returns, I use 4.75-year and 9.75-year returns; I thought that would be more comparable than saying 5.75-year and 10.75-year, and I didn't want to dig into quarterly figures to get actual 5 and 10s.
| OZM fund | S&P500 | |
| 1994 | 28.50% | 5.30% |
| 1995 | 23.50% | 27.40% |
| 1996 | 27.40% | 23.00% |
| 1997 | 26.70% | 33.40% |
| 1998 | 11.10% | 28.60% |
| 1999 | 18.80% | 21.00% |
| 2000 | 20.60% | -9.10% |
| 2001 | 6.30% | -11.90% |
| 2002 | -1.60% | -22.10% |
| 2003 | 24.00% | 28.70% |
| 2004 | 11.10% | 10.90% |
| 2005 | 8.80% | 4.90% |
| 2006 | 14.80% | 15.80% |
| 2007 | 11.50% | 5.50% |
| 2008 | -15.90% | -37.00% |
| 2009 | 23.10% | 26.50% |
| 2010 | 8.50% | 15.10% |
| 2011 | -0.50% | 2.10% |
| 2012 | 11.60% | 16.00% |
| 2013 | 13.90% | 32.40% |
| 2014 | 5.50% | 13.70% |
| 2015 | -0.40% | 1.40% |
| 2016* | 1.10% | 7.80% |
| 4.75 year | 6.53% | 14.58% |
| 9.75 year | 5.48% | 6.72% |
| Since 1994 | 11.68% | 8.92% |
| Since 2000 | 7.29% | 5.27% |
| Since 2007 | 4.82% | 6.86% |
So over time, they have good outperformance, but much of that is from the early years. As they get bigger, it's not hard to see why their spread would shrink.
They are seriously underperforming in the 4.75 year, but that's because the S&P 500 index was coming off of a big bear market low and OZM didn't lose that much money, so I think that is irrelevant, especially for a long/short fund.
More relevant would be figures from recent market peaks which sort of shows a through-the-cycle performance. Since the market peak in 2000, OZM has outperformed with a gain of +7.3%/year versus +5.3%/year for the S&P, but they have underperformed since the 2007 peak. A lot of this probably has to do with the previous charts about how value spreads have widened throughout this period.
I would actually want to be increasing exposure to this area that hasn't worked well since 2007. Some of this, of course, is due to lower interest rates. Merger arb, for example, is highly dependent on interest rates as are other arbitrage type trades. (The less risk there is, the closer to the short term interest rate the return is going to be.)
One thing that makes me scratch my head, though, in the 3Q 2016 10-Q is the following:
OZ Master Fund’s merger arbitrage, convertible and derivative arbitrage, corporate credit and structured credit strategies have each generated strong year-to-date gains through September 30, 2016. In merger arbitrage, certain transactions in which OZ Master Fund participated closed during the third quarter, contributing to the strategy’s year-to-date gross return of +1.3%. Convertible and derivative arbitrage generated a gross return of +0.5% during the third quarter, driven by gains in convertible arbitrage positions, commodity-related volatility, commodity spreads and index volatility spread trades. Year-to-date, convertible and derivative arbitrage has generated a gross return of +1.3%. In OZ Master Fund’s credit-related strategies, widening credit spreads and certain event-driven situations added +0.4% to the gross return within corporate credit during the third quarter, while in structured credit, a +0.9% gross return during the quarter was attributable to the realization of recoveries in certain of our idiosyncratic situations. Year-to-date, the corporate credit and structured credit strategies are each up +1.2% on a gross basis.Gross returns of less than 2% are described as "strong". Hmm... I may be missing something here. Maybe it is 'strong' versus comparable strategies. I don't know. Anyway, moving on...
Greenblatt Genius Strategies
Oh yeah, and by the way, OZM is one of the funds that are heavily into the yellow book strategies. Here's a description of their equity long/short strategy:

This is still a large part of their book, which is a good thing if you believe that the valuation spreads will mean revert and that Greenblatt's yellow book strategies are still valid.
One thing that may temper returns over time, though, is the AUM level. What you can do with $1 billion in AUM is not the same as when you have $10 billion or $30 billion. I don't think Greenblatt would have had such high returns if he let AUM grow too much.
This seems to be an issue with a lot of hedge funds. Many of the old stars who were able to make insane returns with AUM under $1 billion seem to have much lower returns above that level.
Here is OZM's AUM trend in the past ten years. Some of the lower return may correlate to the higher AUM, not to mention higher AUM at other hedge funds too reducing spreads (and potential profits).
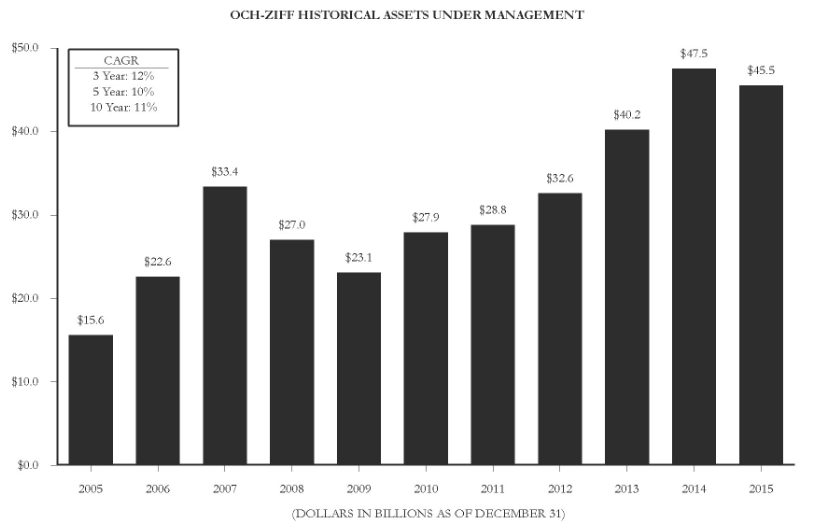
Just to refresh my memory, I grabbed the AUM chart from the OZM prospectus in 2007. Their AUM was under $6 billion until the end of 2003 and then really grew to over $30 billion by 2007.
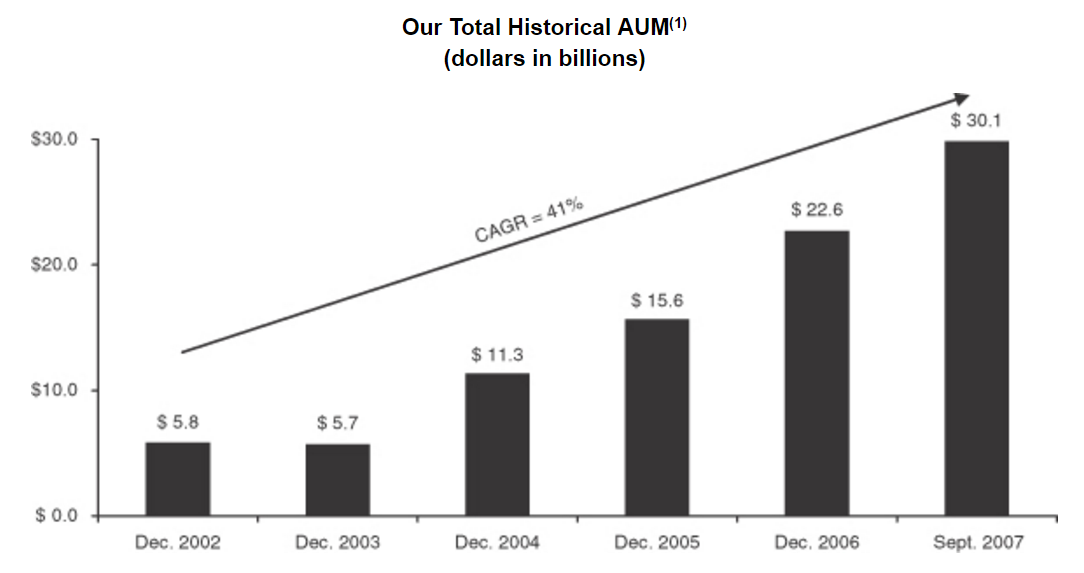
Their 10-year return through 2003 was 18%/year vs. 10.6%/year for the S&P 500 index.
From the end of 2003 through the end of 2015, OZM's funds returned +7.2%/year versus +7.4%/year for the S&P 500 index. So their alpha basically went from 7.4%/year outperformance to flat.
This is actually not so bad as these types of funds often offered 'equity-like' returns with lower volatility and drawdowns. The long/short nature of OZM funds means that investors achieved the same returns as the S&P 500 index without the full downside exposure. This is exactly what many institutions want, actually.
But still, did their growth in AUM dampen returns? I think there is no doubt about that. These charts showing tremendous AUM growth is the reason why I never owned much of these alternative managers in the past few years I've been watching them.
The question is how much of the lower returns are due to the higher AUM. Of course, some of this AUM growth is in other strategies so not all new AUM is squeezed into the same strategies.
Will OZM ever go back to the returns of the 1990's? I doubt that. First of all, that was a tremendous bull market. Plus, OZM's AUM was much smaller so they had more opportunities to take advantage of yellow book ideas and other strategies.
Boom/Bubble Doesn't Mean It's a Bad Idea
By the way, another sort of tangent. Just because there is a big boom or bubble in something doesn't necessarily make that 'something' a bad idea. We had a stock market bubble in the late 1920's that ended badly, but owning parts of businesses never suddenly became a bad idea or anything. It's just that you didn't want to overpay, or buy stocks for the wrong reasons.
We had a boom in the late 1990's in stocks that focused on picking stocks and owning them for the long term as exemplified by the Beardstown Ladies. Of course, the Beardstown Ladies didn't end well (basically a fraud), but owning good stocks for the long haul, I don't think, ever became a bad idea necessarily.
We had a tremendous housing bubble and various real estate bubbles in recent years. But again, owning good, solid assets at reasonable prices for the long haul never became a bad idea despite the occasional bubbles and collapses.
Similarly, hedge funds and alternative assets go through cycles too. I know many value investors are not with me here and will always hate hedge funds (like Buffett), but that's OK.
We've had alternative cycles in the past. Usually the pattern is that there is a bull market in stocks and people rush into stocks. The bull market inevitably ends and people lose money. Institutions not wanting to lose money rush into 'alternative' assets. Eventually, the market turns and they rush back into equities.
I think something similar is happening now, but the cycle seems a bit elongated and, and the low interest rates is having an effect as alternatives are now attracting capital formerly allocated to fixed income. In the past, alternatives seemed more like an equity substitution, risk asset.
Valuation
OK, so what is OZM worth?
Well, a simple way of looking at it is that OZM has paid an average of $1.10/year in dividends in the last five years. During the past five years, the funds returned around 6%/year, so it's not an upside outlier in terms of fund performance.
Put a 10x multiple on it and the stock is worth $11/share.
Another way to look at it is that the market is telling you that it is unlikely that OZM will enjoy the success even of the past five years over the next few years. Assuming a scenario of failure (stock price = 0) or back to sort of past five years performance ($11), a $3.00 stock price reflects the odds of failure at 73% and only a 27% chance that OZM gets back to it's past five year average-like performance. Of course, OZM can just sort of keep doing what it's doing and stay at $3.00 for a long time too.
There is a problem with this, though, as the dividends don't reflect equity-based compensation expense; OZM gives out a bunch of RSU's every year.
To adjust for this, let's look at the economic earnings of the past five years including the costs of equity-based compensation.
Equity-based compensation expense not included in economic income is listed below ($000):
| 2008 | 102,025 |
| 2009 | 122,461 |
| 2010 | 128,737 |
| 2011 | 128,916 |
| 2012 | 86,006 |
| 2013 | 120,125 |
| 2014 | 104,344 |
| 2015 | 106,565 |
It's odd that this doesn't seem to correlate to revenues, income or AUM; it's just basically flat all the way through.
If we include this, economic income at OZM averaged around $520 million/year. With fully diluted 520 million shares outstanding, that's around $1.00/share in economic earnings per share that OZM earned on average over the past five years. So that's not too far off from the $1.10/share dividends we used above.
One of the interesting things about investing is when you find alternative ways to value something instead of just the usual price-to-book values, P/E ratios etc.
So how would you value this?
What about adjusting the implied odds from the above. What if we said there's a 50/50 chance of recovery or failure. Let's say recovery is getting back to what it has done over the past five years on average, and failure is a zero on the stock.
50% x $0.00 + 50% x $10.00 = $5.00/share
In that case, OZM is worth $5.00/share, or 70% higher than the current price. You are looking at a 60 cent dollar in that case.
Let's say there is a 70% chance of recovery.
70% x $10.00 + 30% x $0.00 = $7.00/share.
That's 130% higher, or a 40 cent dollar.
By the way, the AUM averaged around $37 billion over the past five years, and remember, their return was around 5.9%/year so these figures aren't based on huge, abnormal returns or anything.
As of the end of September 2016, AUM was $39.3 billion, and this went down to $37 billion as of November 1, 2016. OZM expects continued redemptions towards year-end both due to their Justice Department/SEC settlement and overall industry redemption trends.
The above ignored balance sheet items, but you can deduct $0.60/share, maybe, of negative equity, or more if you think they need more cash on the balance sheet to run their business.
Preferred Shares
As for the $400 million settlement amount and preferred shares, the settlement amount is already on the balance sheet as a liability (which was paid out after the September quarter-end). The preferred shares were sold after the quarter ended. They have zero interest for three years so I don't think it impacts the above analysis. You would just add cash on the balance sheet and the preferreds on the liability side.
If you want to deduct the full amount of the settlement of $400 million, you can knock off $0.77/share off the above valuation instead of the $0.60/share.
Earnings Model
The problem with these companies is that it's impossible, really, to predict what their AUM is going to be in the future or their performance. Of course, we can guess that if they do well, AUM will increase and vice-versa.
But still, as a sanity check, we should see how things look with various assumptions in terms of valuation.
First of all, let's look at 2015. In the full year to 2015, a year that the OZM funds were down (master fund), they paid a dividend of $0.87. Adjusted economic income was $240 million (economic income reported by OZM less equity-based comp expense) and using the current fully diluted shares outstanding of 520 million, that comes to $0.46/share. OK, it's funny to use current shares outstanding against last year's economic income, but I am trying to use last years' earnings as sort of a 'normalized' figure.
Using these figures from a bad year, OZM is current trading at a 29% dividend yield (using $3.00/share price) and 6.5x adjusted economic income. This would be 8.3x if you added the $0.77/share from the settlement above.
OK, so average AUM was $44 billion in 2015, so even in a bad year, they made tons in management fees. Fine. We'll get to that in a second. AUM is $37 billion as of November 2016, and is probably headed down towards year-end.
2016 Year-to-Date
So let's look at how they are doing this year so far. Fund performance-wise, it hasn't been too good, but they do remain profitable. These fund businesses are designed so that their fixed expenses are covered by their management fees. Big bonuses are paid out only when the funds make money.
Anyway, let's look at 2016 so far in terms of economic income.
In the 3Q of 2016, economic income was $57.4 million. Equity-based compensation expense was $18.3 million so adjusted economic income was $39.1 million. Annualize that and you get $156 million. Using 520 million fully diluted shares (share amount used to calculate distributable earnings in the earnings press release), that comes to $0.30/share adjusted economic income. So at $3.00/share, OZM is trading at 10x arguably depressed earnings. (This excludes the FCPA settlement amount). If you include $400 million of the FCPA preferreds (total to be offered eventually), then the P/E would actually be closer to 12.6x.
For the year to date, economic income was $195 million, and equity-based comp expense was $56 million so adjusted economic income was $139 million. Again using 520 million shares, that comes to $0.25/share in adjusted economic earnings per share. Annualize that and you get $0.33/share.
So at $3.00/share, OZM is trading at 9x depressed earnings, or 11x including the FCPA preferred.
OK, so maybe this is not really 'depressed'. With still a lot of AUM, it is possible that AUM keeps going down.
AUM was $37 billion in November, but let's say it goes down to $30 billion. That's actually a big dip. But let's say AUM goes down there. And then let's assume 1% management fees, 20% incentive fees, and economic income margin of 50% (averaged 56% in past five years) and the OZM master fund return of 5%.
In this case, economic income would be $300 million. Equity-based comp costs seems steady at around $100 million, so we deduct that to get adjusted economic income. This comes to $200 million.
That comes to around $0.40/share. At $3.00/share, that's 7.5x adjusted economic earnings, or a 13% yield, or 9.4x and 10.6% yield including the FCPA preferreds.
So that's not bad. We are assuming AUM dips to $30 billion and OZM funds only earn 5%/year, and with that assumption the stock is trading at this cheap level.
Things, of course, can get much worse. If performance doesn't improve, AUM will keep going down. You can't really stress test these things as you can just say their returns will never recover and that's that.
On the other hand, any improvement can get you considerable upside.
If assets return to $40 billion and returns average 6% over time, economic income margin goes to 56% (average of past five years), adjust economic income per share is $0.76/share and the stock could be worth $7.60/share for more than a double.
Here's a matrix of possibilities. Skeptics will say, where are the returns below 5% and AUM below $30 billion?!
Well, OK. If returns persist at lower than 5%, it's safe to assume that AUM will go down and this may well end up a zero. That is certainly a possibility. It wouldn't shock many for another hedge fund to shut down.
On the other hand, if things do stabilize, normalize and OZM recovers and does well, there is a lot of upside here. What is interesting to me is that the market is discounting a lot of bad and not pricing in much good. This is when opportunities occur, right?
| 5% | 6% | 7% | 8% | 9% | 10% | |
| 30,000 | $0.45 | $0.52 | $0.58 | $0.65 | $0.71 | $0.78 |
| 35,000 | $0.56 | $0.64 | $0.71 | $0.79 | $0.86 | $0.94 |
| 40,000 | $0.67 | $0.76 | $0.84 | $0.93 | $1.01 | $1.10 |
| 45,000 | $0.78 | $0.87 | $0.97 | $1.07 | $1.16 | $1.26 |
| 50,000 | $0.88 | $0.99 | $1.10 | $1.21 | $1.32 | $1.42 |
| 55,000 | $0.99 | $1.11 | $1.23 | $1.35 | $1.47 | $1.58 |
| 60,000 | $1.10 | $1.23 | $1.36 | $1.49 | $1.62 | $1.75 |
The row above is the assumed return of the OZM funds. The left column is the AUM. Assumptions are 1% management fee, 20% incentive fee, 56% economic income margin (excluding equity-based comp expense) and $100 million/year in equity-based comp expense.
It shows you that it doesn't take much for adjusted economic income per share to get back up to closer to $1.00, and can maintain $0.45/share even in a $30 billion AUM and 5% return scenario making the current stock price cheap even under that scenario.
Conclusion
Having said all that, there is still a lot of risk here. Low returns and low bonuses can easily make it hard for OZM to keep their best people. But if their best people perform, I assume they do get paid directly for their performance so that shouldn't be too much of an issue.
A lot of the lower returns in recent years is no doubt due to their higher AUM. But it is also probably due to crowding of the hedge fund world and low interest rates leading to an overall lower return environment for all.
If you think these things are highly cyclical, then you can expect interest rates to normalize at some point. Money flowing out of hedge funds should also be good for future returns in these strategies. The part of lower returns at OZM due to higher AUM may not reverse itself, though, if OZM succeeds in maintaining and increasing AUM over time.
But even without the blowout, high returns of the 1990's, OZM can make decent returns over time as seen in the above table.
In any case, unlike a few years ago, the stock prices of many alternative managers are cheap (and I demonstrated how cheap OZM might be here) and institutional money seems to be flowing out of these strategies.
So:
- OZM is cheap and is in a seemingly universally hated industry
- Money is flowing out of these strategies, particularly performance chasing institutions (that you would often want to fade)
- there is a bear market in active managers and bubble in indexing (which may actually increase opportunities for active managers)
- value spreads are wide and has been widening for years making mean reversion overdue
- etc.
These things make OZM a compelling play on these various themes.
I would treat this more like an option, though. Buy it like you would buy an option, not like you would invest in, say, a Berkshire Hathaway.
There are a lot of paths here to make good money, but there are also plenty of ways to lose. If you look at this like a binary option, it can be pretty interesting!
Hi there, OZM is a bit esoteric for me, but your thinking on banks has been excellent. Any thoughts on the banks after the surge? My guess is higher rates will still take time to materialize, but a better regulatory environment should probably justify a re-rating... Thanks.
ReplyDeleteHi, sorry, I missed this post. I still do like banks and other financials. Maybe overdone in the short term, but should be good over the long haul...
DeleteInteresting and well done. If you have the time, perhaps you can compare it to Fortress Group (FIG) another interesting stock in the same industry.
ReplyDelete"Trading at 10x depressed earnings"
ReplyDeleteWhy are the earnings depressed if 1) AUM is declining 2) there will likely be pressure on fees 3) markets are at all time highs
Given the above, I would argue that 10x is pretty high on a current earnings base. Other AuM appear to be cheaper e.g. OAK
*other alternative asset managers (not other AuM)
DeleteWell, earnings are clearly depressed as they are not earning what they used to. Remember, they paid out an average of $1/share not too long ago.
DeleteThe pressures you mention are true, but that is just a question of whether the earnings are at bottom or not. Anyway, yes, it's true AUM can keep going down etc.
Markets at all time highs, to me, are not as relevant as OZM is long/short. Raging bull markets can be bad for these guys as institutions may actually prefer going long instead of long/short.
In any case, I don't know what will happen, but at these levels, it's an interesting situation.
I do like OAK, actually.
AUM could easily fall more dramatically than from $37 bn to $30 bn... of course, if performance improves and AUM grows, there is considerable option value
ReplyDeleteWhy not go long FIG too? The best relative value of the alt asset mgrs is CG. OZM and FIG will trade at a discount because their capital is not sticky. Look at the alt AMs, the guys like BX and KKR are at 8% - 10% of AUM for equity valuation. That reflects, at least for KKR almost exclusive sticky 2/20 pe money and BX has that + the massive RE. As you get into less sticky capital that requires more overhead (a L/S equity person won't necessarily scale to convertible arb, but a team of 8 can run multiple LBO funds), the valuation on a price per AUM basis goes down.
ReplyDeleteI'd argue OZM and FIG can do well as trends reverse but you won't get much more than that in terms of multiple expansion. Bot OZM and FIG are at 3% - 4% of AUM which is fair to rich for hedge fund-y, quarterly liquidity w/fee pressure managers.
CG is what you should take a look at. Due to its traditional asset mgmt expansion, it's suffered a bit operationaly and valuation wise. It's valued at about 3% AUM, same as FIG and OZM. CG is a top tier PE brand and peers like KKR and BX are 10% and 8% of AUM respectively for valuation. CG could re-rate to a 6% of AUM valuation - comparable to Oaktree which is mostly a premier name in distressed - but IMO a much better business given the better fee structures in PE vs credit/distressed. Even w/no operational improvement, CG could re-rate to 6% of AUM which would be a double, when you tack on improving operating performance and the re-rate you get over a 100% return.
I think your OZM thesis relies more on operational improvement but has low likelihood of multiple expansion.
Thanks for the thoughtful response. I do like the other alt managers and think they will do well as a basket over time because they are all cheap. My only reservation is the same as I've been saying; their recent huge AUM make me wonder what returns will be going forward. BX is the gold standard in this area for sure.
DeleteI've been following FIG since the IPO and haven't really been a big fan. Their hedge funds are awful, and other funds seem mediocre. I guess they have some decent funds too, but overall doesn't seem as consistent as some of the others.
So that's probably why it's cheap. I should take another close look, though.
CG too is top notch firm. Dimon'ss #2 went there for a while before jumping ship to Comcast.
Anyway, these are all great ideas, but for OZM, I was looking at them specifically because they are trading down 90% from their IPO, they had their bribery problem and some performance problems that may be attributed to the cyclical factor that I have been talking about here as a theme (value spread widening for years on end).
So in that sense, it's a play on buying distressed OZM while it's down due to bribery distraction, redemptions following that, poor performance due to what I guess may be hugely cyclical factors that might snap back at any moment etc.
This idea, in that sense, was a bit more specific.
I don't see private equity now really in a distressed environment. The exit market is excellent etc...
Anyway, thanks for the interesting discussion. Maybe it's time for some alt manager posts here. But before that, I have one conventional manager in the queue...
I think it comes down to the business itself, not the performance. If you look at the alt managers, BX and KKR are at premiums. Then if you look at ARES and APO - who I think are awesome - they are at 4% or so. OAK is around 6%, the most overvalued. Part of the reason is that ARES and APO have a lot more credit vs PE and OAK is almost all credit and has a lot of traditional credit as well. Credit funds are shorter duration (6 years), lower performance fees (1/10 or 1/15), and are more expensive to run in terms of the trading operations and research. The overall return profile on a gross basis is not that exciting either meaning the cyclical performance fees don't juice or leverage your operating structure. You just won't make the PE returns in credit and if you do cause you're in Greek distressed, it's a very small part of the 100B plus a firm like this manages. So lower upside incentive fees, more people needed to run the strategy, shorter duration AUM relative to PE and RE. In PE, you can run billions with 5-6 people.
DeleteGo further down the scale from OAK, ARES, and APO to FIG and OZM, yeah FIG sux, but FIG and OZM have quarterly liquidity (i know FIG has 56% of AUM in traditional asset mgmt), fee compression, and in both cases need a significant infrastructure to run their operations. So you have on a blended basis less upside, less sticky capital, and more challenges in leveraging your cost basis.
I haven't researched the sector in a while but conventional and alts are all the same, it's valuation based on AUM. The real outlier right now is CG, Carlyle as we acknowledge is a top tier PE firm, it's valuation against its AUM is the lowest in the entire peer group.
It's difficult to compare KKR to BX or the other alternative asset managers on a % of AUM basis, given its decision to retain a substantial part of its earning for balance sheet investments - it has >10bn in cash + investments on its books.
DeleteIf you net that out, it's trading at 4.5% of AUM, similar to the credit guys or CG, and arguably KKR has much stickier money / better reputation.
OZ has a highly concentrated investor base, unlike Fidelity or Vanguard.
ReplyDeleteThe right price for this stock is 1% of net AUM. Still 50% overvalued assuming 39bn AUM.
One can use the same approach to Fortress and Oaktree. Blackstone is worth slightly more.
Long time reader, first time commenter... Love your thoughtful posts, thanks.
ReplyDeleteFor what it's worth, I noticed that Seth Klarman unloaded his OZM last quarter. Looks like a miniscule position to begin with so maybe meaningless, but one more data point at least.
http://www.dataroma.com/m/m_activity.php?m=BAUPOST&typ=a
Thanks for the post. An excellent analysis as usual, but especially because I think you acknowledged the risks in the right way. I think it's tempting, especially if you've followed something like the Buffett mold, to try to only invest in sure shots where there's a large moat and you're pretty sure it'll last for a very long time. OZM definitely isn't that, and as you mention, there are lots of scenarios where it goes to 0, but it does seem like it could be over-discounting that. If you make enough small bets like this then it should probably work out for you over time.
ReplyDeleteAlso, this whole thought of perhaps hedge fund performance being cyclical reminded me of Affiliated Managers Group (AMG), which has a pretty solid track record of buying chunks of hedge funds. It definitely isn't as cheap as OZM, but it is very diversified, so the real business risk is certainly much less. Looking at it now, it has fallen 30% or so and trades at ~8x pretax earnings. I don't know a whole lot about it (I think I read their shareholder letter but that's about it) but they're exposed to how well hedge funds do and they do have an undisputedly good track record in buying stakes in them, so if you're right about investors hating hedge funds too much then it's another interesting place to look.
Oh well I just saw you mention them in the post on Pzena. Anyways, thanks again for the post!
DeleteCurious why there is little mention of "Och-Ziff to Pay Over $400 Million in Bribery Settlement"
ReplyDeleteInstitutions will now begin to request redemptions, over the next quarters/years.
Anyway, good starting point on a worthy discussion. Thanks.
Hi, that is already baked into the balance sheet. Preferreds were offered after September-end.
DeleteThis thing has been hanging over OZM for a while now, and a settlement is usually the end of the uncertainty, not the beginning. So yes, there will be redemptions towards year-end as they said and maybe some into the new year.
Hey kk,
ReplyDeleteThoughts on Q4 and 2016? Seems like AUM is down about as expected, while performance in the master fund, credit opportunities fund and real estate were all decent. Combining that with the still wide value gap in the overall market, Vanguard passing $4T in total assets, and the final FCPA settlement feels like we're close to trough for active managers and OZM specifically while the market is still pricing in all downside and no upside. Thanks.
KK
ReplyDeleteWould appreciate any updated comments, especially in light of Q4 results and the stock trading down to $2.50. A cheaper priced option that you still hold, or something to be avoided based on the latest news? I suspect the former but would appreciate your insight.
Thanks
Bronx Cheer
Hi, I was wondering how you calculated how many diluted shares outstanding they have? They claim to have had 480 million at the time of when you wrote the article but you used 520. They have a very complex equity structure and I was hoping you could shed light on how to look at it. Thanks.
ReplyDeleteHi, I think I added unvested RSU's and unvested class A shares. Not entirely sure if it is correct, but to bias on the conservative side, I added them to shares outstd. Look at the very bottom of the 10-K.
Delete