But it sort of depends on which way the 'snap' is happening. What if bonds were way overvalued versus stocks? In that case, bonds can tank a lot before stocks have to correct. Bears have been saying forever that once the bond market turns and interest rates start to go up, the stock market will crash.
Maybe so.
Let's take a step back and look at what's going on. How can bonds go down and stocks go up?
Here is a look at the earnings yield versus 10-year bond yields since 1871. The data is from Shiller's website:
S&P 500 Earnings Yield versus 10-year Bond Yield
(1871-November 2016)
(1871-November 2016)
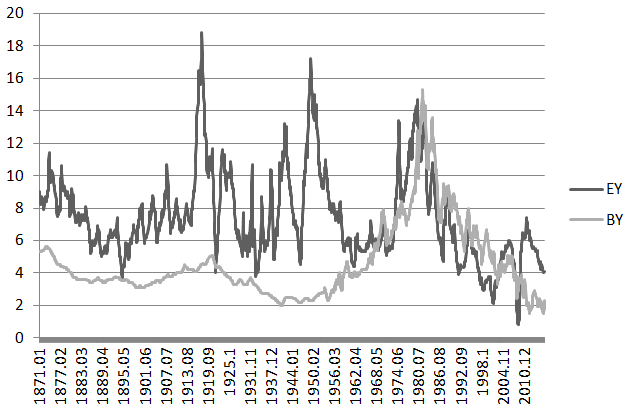
Earnings yield and bond yields have sort of tracked each other closely since the 1960's or so. Recently, bond yields went down a lot while earnings yield refused to follow it down. This spread is sort of a cushion for the stock market. Since the spread is so wide, it's not unnatural for both of them to go in opposite directions.
Here is a close-up of this chart from 1950. You can see that that bond yield and earnings yield do sort of track each other, and there is a cushion between them so rising bond yields at the moment do not pose an imminent threat to stock valuations.
S&P 500 Earnings Yield versus 10-year Bond Yield
(1950-November 2016)

Back in 1987 and 2000, for example, bond yields were higher than earnings yield. Back in 1987 before the crash, this spread blew out from 1.3% in December 1986 to 4.4% in September 1987. That was the rubber-band stretch that caused the market to 'snap' (Black Monday) back into normalcy.
In January 2000, the gap also blew out to 3.3% from less than 1% after the Asian Contagion of 1997.
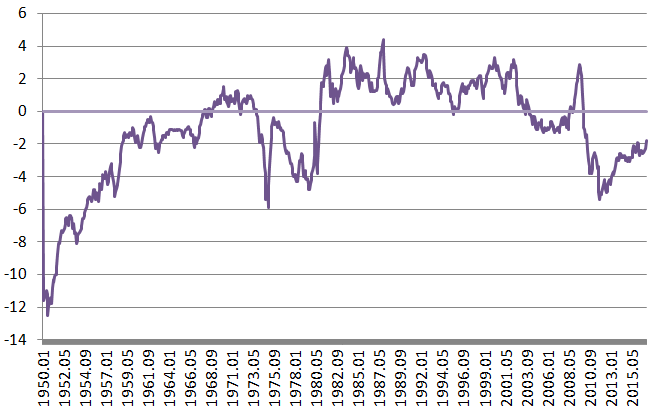
Here is the spread between bond yields and earnings yields since 1950:
Bond Yield - Earnings Yield
(1950-November 2016)
...and here's a close-up since 1980:
Bond Yield - Earnings Yield
(1980-November 2016)
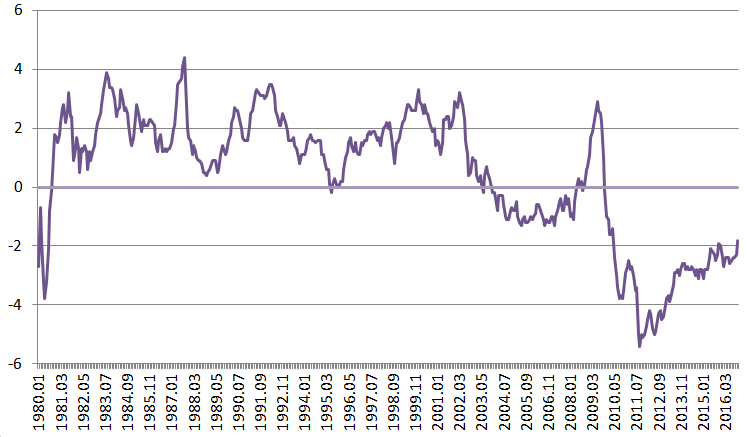
You can see that pre-Black-Monday-spike in the spread in 1987. Just because the spread is wide doesn't mean a correction is coming, of course. The spread widened many times since 1980.
Nor does it mean that the market can't correct or crash when this is negative. In fact, the spread was negative before the financial crisis in 2007. That spike you see in the spread chart above actually happened in 2009 when earnings plummeted.
But it is sort of a big-picture-rubber-band indicator. A correction in bonds doesn't automatically mean we must correct in stocks. One way to look at it may be that if the spread widens too much above zero, it's a warning sign. We are far from that at this point.
P/E's Too High
From the above, we can sort of see that earnings yields and bond yields track each other. I know many people argue that this Fed model is no good. OK, so maybe it's no good, whatever that means. But you can't really separate the risk free interest rate from asset valuations. Whether you want to use 2.3% to discount long term assets or not is another issue. But over time, of course the treasury rate is going to be a huge factor in determining asset prices.
So, instead of looking at yields, I just drew the same charts as above but using a P/E ratio. Instead of a bond yield, I created the bond P/E ratio (inverse of yield).
Check it out:
S&P 500 P/E versus 10-year Bond P/E
(1871-November 2016)

...and here's a close up:
S&P 500 P/E versus 10-year Bond P/E
(1950-November 2016)
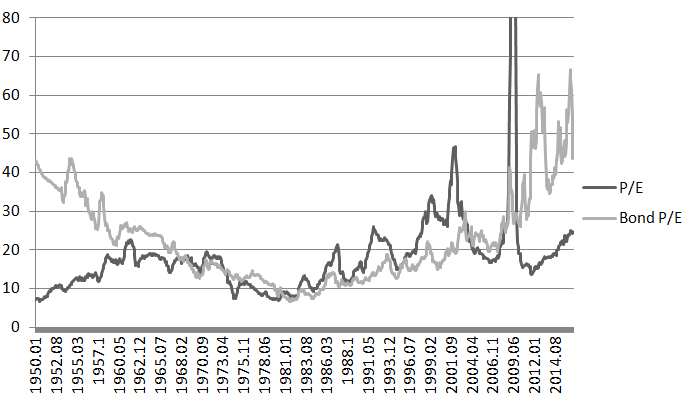
So you see how bonds are way more overvalued than stocks. Well, actually, I really don't know if bonds are overvalued or not. In order to know that, I would have to know what future inflation and economic growth is going to be, and I don't know that.
I am always baffled at comments like, "The market has averaged a P/E ratio of 14x for the last 100 years so the stock market is 40% overvalued at 20x...".
How can you compare 14x P/E to the current level without discussing interest rates? And if you think stocks should trade at 14x P/E today, then you should also think that interest rates should be much higher than they are now. For example, the 10-year bond rate averaged 4.6% since 1871 and 5.8% since 1950. But these periods include a time when interest rates were not set by the market.
OK. So far, we have determined that the bond market rout up to now is no cause for concern for the stock market. Yields of 2.3% is still way below earnings yield.
So What Should 10-year Treasuries Yield?
Obviously, this is the next question. I am no economist so I actually have no idea, but one idea I have always liked is that someone said that long term interest rates should be equal to real GDP growth rate plus the inflation rate, or more simply, nominal GDP growth. This sort of makes sense.
So below is a chart of nominal GDP growth versus the 10-year bond yield. The data is from the FRED (St. Louis Fed) website.
Nominal GDP Growth versus 10-year Treasury Rate
(1930-2015)
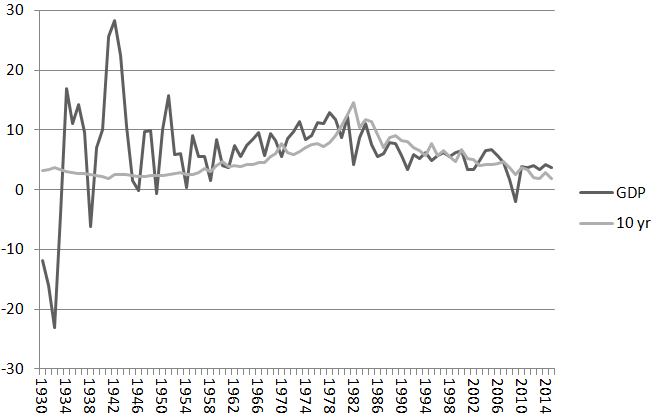
Not so bad tracking. Here's a close-up from 1950:
Nominal GDP Growth versus 10-year Treasury Rate
(1950-2015)
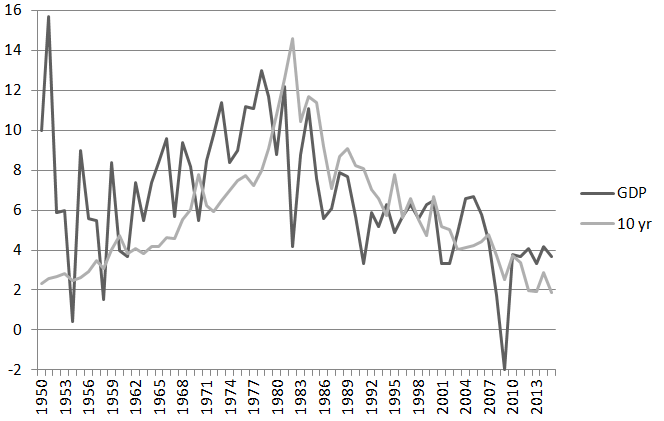
From this chart, you can see that the bond market is in fact overvalued, even with a yield of more than 2%. Either that, or the market is expecting nominal GDP growth of only 2.3% or so as of now. As usual, we don't know who is right.
I read a quote of Jeffrey Gundlach of Doubleline saying that he thinks long term rates can get up to 6% in a few years. I don't know if he was referring to the 10-year or 30-year. But who looks at the 30-year anyway, right?
But for yields to get to 6%, Gundlach must be expecting much higher inflation. Real GDP is probably not going to grow that much more than 2%. Maybe 3%. But if it does grow 3%, we only need 3% inflation to get to a 6% bond yield. OK. Maybe that's possible.
So should we be worried about 6% long term rates?
Here is a snip from my Scary Chart post from this summer.
Interest rate range average P/E
4 - 6% 23.3x
6 - 8% 19.6x
I looked at the data from 1955-2014 (adding one more year to update this isn't going to change much) to see what the average P/E ratios were when interest rates were in certain ranges.
From the above, we see that the market traded at an average P/E of 23.3x when interest rates were between 4% and 6%. The 10-year now is at 2.3%. So we have a long, long way to go for interest rates to threaten the stock market, at least in terms of the bond-yield/earnings-yield model.
Even if rates got up to the 6-8% range, the average P/E has been 20x P/E, or where the stock market is now on a current year basis.
So even if interest rates popped up to 6-8%, the stock market has no need for a valuation adjustment.
Of course, the market can still react negatively to big moves in the bond market, and of course, higher interest rates will impact earnings of companies with debt. This may be offset by a stronger economy if that's what leads to higher rates, not to mention higher earnings at banks and other financials that have been suffering under this low rate environment. It's always tough to model this stuff out.
As we have seen recently with the election, nobody really knows what's going to happen. And even when things are predicted correctly, the market reaction tends to surprise.
From the above blog post, here is a regression analysis of bond yields versus earnings yields. The 1980-2007 period seems overfit for sure; it's a period when stock yields and bond yields tracked each other very closely. I think I used the excuse that post-2007, we have been living in a post-crisis environment of unnaturally low interest rates.
So you can reject that regression as not valid.
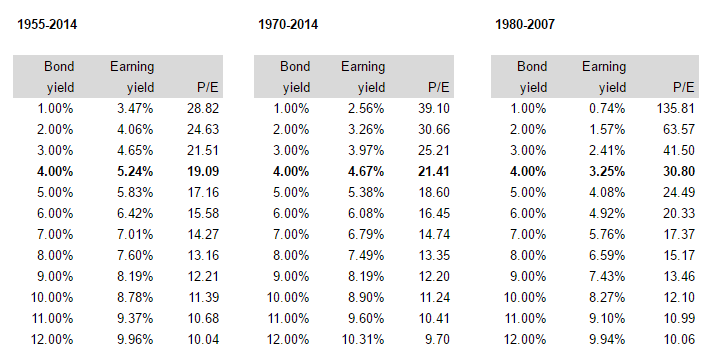
Here is the original post when I looked at the relationship between bond yields and earnings yields:
scatterplot.
Again, keep in mind that long term rates after the post-election 'plunge' is 2.3%. The above regression shows that even at 4% bond yields, almost double the current level, the market tends to trade at anywhere from 19x to 31x P/E.
Conclusion
So bond prices have tanked and the stock market doesn't care at this point. Bears say this can't go on and that overvalued stocks will follow bonds down soon.
The above shows that
- The recent plunge in bonds is a rubber band snapping back (bonds way overvalued versus stocks) and not a rubber band stretching that will eventually snap (like the bond crash before Black Monday).
- Bond yields are still below earnings yields so current bond market correction shouldn't be a threat to stock prices at current or much higher levels.
- Bond yields will probably have to get much higher than earnings yield before it becomes a serious threat to stock prices.
- Even with bond yields at 6-8%, stocks prices can be reasonably valued at current levels.
- Saying the stock market is overvalued with respect to historical averages is nonsense without reference to historic relationship to bond yields.
- etc...
Having said all that, of course the market can still tank for any number of reasons; geopolitical issues, economy tanking, some sort of crisis etc.
This only isolates and looks at two factors. And according to those two factors, there is no tension that needs to be resolved.
Since I tend to post these and other charts on occasion, and it's a hassle for me to update every time, I am going to set up a companion website to this blog that will have this data and charts that I can update and reference so I don't need to update and cut/paste into a blog post. Also, anyone can go there and look at it at any time to see what these indicators are saying.
There will be other information/data posted there too as sort of my public, personal investment notebook.
I will provide a link to it when it's ready.
The "what happens to stocks if rates change, all things equal" argument is flawed because the rate changes are evidence that things are no longer equal.
ReplyDeletehttps://blogs.rhsmith.umd.edu/davidkass/uncategorized/warren-buffetts-meeting-with-university-of-maryland-mbams-students-november-18-2016/
ReplyDeleteQuestion 7: What impact have the fixed income markets had on stocks?
WB: Interest rates are to asset valuation as gravity is to matter. It will take a lot of movement in interest rates (similar to Paul Volcker in 1981-2) before stocks are too high. The interest rates on 30 year Treasury bonds have declined from 14 ½ % to 2 ½ % from 1982 to 2016. Recently, the 30 year Treasury moved from 2.6% – 2.8%. Stocks are cheap if long term rates are at 4%, four to five years from now. “We are buying more shares than selling everyday unless interest rates move appreciably higher”. A profitable trade would be to short the 30 year bond and go long the S&P 500 (assuming no margin calls). But this is difficult to do on a big scale. Borrowed money causes more people to go broke than anything else. Charlie Munger has said, smart people “go broke from liquor, ladies and leverage”.
"If you think stocks should trade at 14x P/E today, then you should also think that interest rates should be much higher than they are now."
ReplyDeleteThis is wrong. Nominal interest rates should have no impact on a stock's valuation.
Valuation = Cash Flow / (discount rate - growth rate)
On the surface, if the interest rate you use for your discount rate rises because of inflation, then, your valuation falls. However, consider that your growth rate would also rise by the same amount. So the end result is that your valuation wouldn't be affected.
Only changes in the real interest rate would affect valuation. In the current environment interest rates were (and still are) very low. Does that mean stock prices should be high? Absolutely not! With virtually no aggregate inflation, nominal growth is also very low. Thus low rates, if accompanied by low growth, should generate the same P/E as high rates/high growth.
Interesting point. This is one of those theoretical things that I don't understand. If you look at history, P/E ratios don't really track 'real' interest rates at all. They do track nominal interest rates.
DeleteThis may be because the "g" in growth is also nominal. So if you bump up inflation, "g" goes up too. Most big corporations would LOVE inflation to get back up to 3-4% like in the 80's; they would get back pricing power and boost earnings!
So if you use 'real' interest rates, then you have to use 'real' growth rates. And then it just nets out because you end up with inflation in both the top and bottom of the fraction.
Earnings growth over time, I would assume, would track nominal GDP growth, not real GDP growth.
And then that leads to the paradox. If earnings growth tracks nominal GDP (good long term proxy, cuz earnings can't grow more than that over long periods) and nominal GDP is a good proxy for long term interest rates, and if long term interest rates are a good indicator of fair value P/E or earnings yield, then you get the silly equation: Price = cash flow / (nominal GDP growth - nominal GDP growth).
But anyway, interesting discussion.
oops... forgot to mention: then in the above case, if rise in inflation leads to rise in growth rate, then interest rates will have no effect on valuation. But this just hasn't been the case historically...
DeleteJapan and Europe are a counterpoint to this. There appears to be no correlation between their nominal interest rates and P/E ratios in recent decades. If anything it might even be negative. The U.S. has definitely seen rates fall and P/Es rise since 1980. But as we all know, correlation does not necessarily imply causation. I suspect that, ultimately, nominal interest rates (within reason) have practically no impact on P/E ratios.
DeleteAgreed, correlation doesn't imply causation. I actually don't spend a whole lot of time on this sort of thing, so I actually have no idea what I'm talking about.
DeleteBut having said that, I have been watching Japan for years. What is happening in Japan, Europe, and the U.S. now is not proof that interest rates have no impact on P/E ratios.
I will still stubbornly insist that risk-free interest rates are a key factor in determining asset prices.
Now, what you see around the world and lack of correlation is due to the fact that interest rates have gotten so low that risk asset purchasers refused to lower their discount rate suggested by long term rates. In other words, equity investors refused to buy the stock market up to 200x P/E when rates got down to 0.5%, for example.
Risk asset investors, quite smartly in my view, don't want to pay 100x P/E for a risk asset even if rates are at 1%.
This doesn't mean there is no relationship. There is. But at certain extreme levels, people put their own floor on discount rates regardless of how low risk free rate gets.
That's a far different reality than saying that interest rates have nothing to do with P/E ratios. It may be true 'locally' with rates and P/E's at current levels.
But in general, I still think interest rates are a major factor in determining asset prices. If you don't agree with that, I don't know what to say because it's just the way I was trained, and maybe that is wrong. Who knows. But it doesn't matter, really, to me for what I do...
Anyway, thanks for the interesting discussion!
For your consideratin on this topic http://faculty.som.yale.edu/jakethomas/otherpapers/Asness.pdf
DeleteThanks for the Asness report. Yeah, I remember reading that a while back. I can't argue with a professional quant...
DeleteBut I will say that I agree with the lack of predictive ability of this model. He says Wall Street Strategists and TV pundits fall for this fallacy, but so does Buffett (as seen in post above, and in previous Berkshire letters where he does compare yields with earnings yields).
All I can say is that the post above is not about finding what the true theoretical value of the stock market is (I have no idea) or what the correct P/E ratio should be today (I have no idea) or what future returns will be (again, I have no idea).
The post and charts are just a direct response to those who say that the bond market tanked so therefore the stock market must too.
I was looking for evidence of the need for the stock market to correct to make up for increasing yields in bonds, and as I convinced myself from the above charts, I concluded there is no such need.
Otherwise, there is no more to it than that, really.
Anyway, I will read the study again and if I have anything to add, I will respond here.
Thanks for posting it!
Have a great turkey!
I am absolutely no expert on this, but much of your analysis seems predicated on the idea that stock valuations are related to interest rates. Perhaps, I am missing the point, but Mark Hulbert recently noted in a November 23 MarketWatch article: "Consider a now-classic study by Cliff Asness that appeared in the Fall 2003 issue of the Journal of Portfolio Management. Asness measured whether the predictive success of the P/E ratio is in any way improved by adjusting it according to prevailing interest rates. He found that its track record actually became worse, not better." That suggests that your two periods of interest rates as compared to stock P/Es is coincidental and not predictive of the future. I'd love to find a way to justify the currently high P/Es, but I just convinced myself the other day that interest rates is not a valid way to defend the currently high stock valuations. Curious as to your thoughts. Very interesting article and blog.
ReplyDeleteWell, there is a problem, usually, when people try to model some sort of predictive thing so that doesn't surprise me at all. I used to spend time a long time ago creating valuation models, trading models etc...
DeleteBut you can't really separate risk free interest rates from asset prices. If you don't believe that, I have nothing further to say, really.
As for the lack of correlation these days in the U.S, Europe, and Japan, see my response to the above post.
Again, keep in mind that this is not my bag. I don't spend much time on this stuff these days at all, so am only a casual observer/commentor in these sorts of things...
I think we can agree that risk free rates affect asset prices since you need to discount cashflows :-). However, I would like to comment on a few pointa.
ReplyDeleteThe duration of stocks is 1/Dividend Yield (see for example Hussman's posts). This means your typical stock has a duration of 50 years or so whereas 10y Treasuries have a duration of 8 years or so. So comparing earnings yields to Treasury yields is not an apples-to-apples comparison and earnings yields should be higher (i.e. PEs lower).
You can remedy this if govies with sufficiently long duration exist (e.g. Mexico's 100y bond or Austria's 70y bond). Those yields would be compareable in terms of duration, for discounting you should throw in some risk premium (because equities are volatile, can become worthless etc.). This depends on your risk appetite, but again earnings yields should be higher (again PEs lower).
Now, assume you did that. Since stocks produce an infinitely long cashflow that you discount (standard DCF model) you have to assume that bond yields stay this low for a really long time (otherwise you discount cashflows farther out in the future with a higher yield and these drive the valuation at the end of the day, not the cashflows over the next five years or so). Which is a pretty strong assumption imho.
The same holds for corporate profits as a share of GDP btw (currently at 10% or so at the expense of labor whereas the historical average is closer to 6%).
To sum it up, you can use current govie yields as a justification for (imho rather high) stock prices, but you have to make a bunch of rather strong assumptions. I personally am in the "This time it's not different camp", though and think that stocks are significantly overvalued.
Let me weigh in and say OF COURSE risk-free interest rates are a key factor in determining asset prices. This is just common sense.
ReplyDeleteI mean, I'm no expert, but I'd say this statement is about as controversial as saying "corporate earnings are a key factor in determining stock prices".
The impact of small moves in interest rates is obscured by all kinds of noise, including the relative valuation of stocks vs bonds as pointed out by kk (and also including stuff like sentiment, GDP, corporate margins, commodity prices, and etc, etc).
But larger changes in rates are a big deal. Let's say that I could get a risk-free government-guaranteed return of 10% on my money. Wow. That would make the stocks I own WAY less attractive at their current prices.
Any claim that interest rates aren't a key factor just doesn't pass the smell test.
Someone posted this comment and didn't show up here for some reason (I got an email alert): Eddie wrote:
ReplyDeleteI think we can agree that risk free rates affect asset prices since you need to discount cashflows :-). However, I would like to comment on a few pointa.
The duration of stocks is 1/Dividend Yield (see for example Hussman's posts). This means your typical stock has a duration of 50 years or so whereas 10y Treasuries have a duration of 8 years or so. So comparing earnings yields to Treasury yields is not an apples-to-apples comparison and earnings yields should be higher (i.e. PEs lower).
You can remedy this if govies with sufficiently long duration exist (e.g. Mexico's 100y bond or Austria's 70y bond). Those yields would be compareable in terms of duration, for discounting you should throw in some risk premium (because equities are volatile, can become worthless etc.). This depends on your risk appetite, but again earnings yields should be higher (again PEs lower).
Now, assume you did that. Since stocks produce an infinitely long cashflow that you discount (standard DCF model) you have to assume that bond yields stay this low for a really long time (otherwise you discount cashflows farther out in the future with a higher yield and these drive the valuation at the end of the day, not the cashflows over the next five years or so). Which is a pretty strong assumption imho.
The same holds for corporate profits as a share of GDP btw (currently at 10% or so at the expense of labor whereas the historical average is closer to 6%).
To sum it up, you can use current govie yields as a justification for (imho rather high) stock prices, but you have to make a bunch of rather strong assumptions. I personally am in the "This time it's not different camp", though and think that stocks are significantly overvalued.
and my response is, good point. I don't actually disagree with anything Asness says either, and I agree with the Eddie's points too.
DeleteAs for the above comment, the whole point of all of this analysis on my part is that I do claim that indeed, "this time it's not different". That's why I provided decades of data showing the relationship between bond prices and stock prices, and given that, we are not at all out of whack, like we were prior to black monday, or even 1999/2000.
Asness and others point out that this is actually incorrect, that the market should not trade in step with bonds and I understand that theoretical argument too. But that sort of leads to sillier valuations, actually. And I agree totally with Asness that the Fed model is useless in predicting future returns. I don't know why he would think a measure that can oscillate between 2% and -2%, for example, would in any way predict future stock prices. Just like yields can predict bond returns, the best estimate of future stock returns is of course raw dividend yield + GDP growth rate.
Anyway, back to the above, my point in this analysis is to just show the relationship between bond and stock prices that even Asness acknowledges exists.
This is no more than, for example, me saying that a certain stock tends to trade between 18-20x P/E, and is now trading at 15x so is undervalued. Or that another stock trades, usually, around 1.2 - 1.5x book, and is now at 1.0x so might be interesting.
Now, the above statements are things I might say or hear others saying and have no problem with it. But at no time is there a claim that the 18-20x is actually the correct P/E, or that 1.2-1.5x PB is the correct P/B ratio. Well, sometimes we do break it down and try to find the 'correct' level.
But often, it's just historical precedent and tendency that determines prices, just like the concept of private market value (buyout valuations of certain types of companies etc.).
Those too, are precedent-based, and is not necessarily indicative of 'true' value as corporations and LBO firms too sometimes overpay (or underpay).
But we still use it as an indication of value.
The above analysis, in my mind, is no different. It doesn't really claim to be the theoretically correct way to set stock prices or anything like that. It merely shows how these markets have tended to move together in the past, and using that relationship, there is nothing really out of whack now.
So, my claim is actually, 'this time is no different'. If the past is any indication, stock prices are not overvalued unless long term rates get to 6-8% or higher (which is the same thing Buffett said the other day)...
Anyway, again, thanks to all of you for an interesting and stimulating discussion!
On your comments about 'correct' PE, PB, or other valuation measures:
DeleteI would go as far as to say there is no such thing as 'fair value' for an asset --- to my thinking there is only 'expected return'.
And, clearly, if the expected return is way too high, or way too low (relative to competing assets, such as available risk-free returns), then an asset could be said to be 'cheap' or 'expensive'. However, I do not believe that there is some specific 'fair value' number that we should try to figure out.
In response to Eddie's comment "the duration of stocks is 1/Dividend Yield".
DeleteMany stock-market models that use dividend yields are out-dated: A lot of these models don't account for share buybacks. This makes sense because buybacks weren't really a factor historically, but it's a huge problem for these models now. For instance in 2015, 60% of the S&P 500 cash distributions were in the form of buybacks and only 40% were dividends (net of stock issuance, this is still 55% buybacks, 45% dividends).
So for 2015, the dividend yield on the S&P 500 was only about 2%, but the net distribution yield was more like 4.5%.
Counting these repurchases would DRAMATICALLY alter certain valuation models, as well as other calculations such as Hussman's duration of nearly 50 years for the US market (it should be more like 20-25 years).
Wisdomtree 2015 data link:
https://www.wisdomtree.com/-/media/US-Media-Files/Documents/resource-library/documents/schwartzcommentary/WT-Research-Commentary-06-02-16-95.ashx
I like the way you tied all the information together about stock and bond.stock and bonds, Corporation stock
ReplyDeleteA bit late to the party here, but your point of view is really solid. I've developed a number of quantitative timing/pricing models for the equity markets, most of which lean heavily on rates. There is easily some wiggle room for rates to move higher without negatively impacting equities.
ReplyDeleteNice job on composing a clear visual on why this is the case.